

each::storage
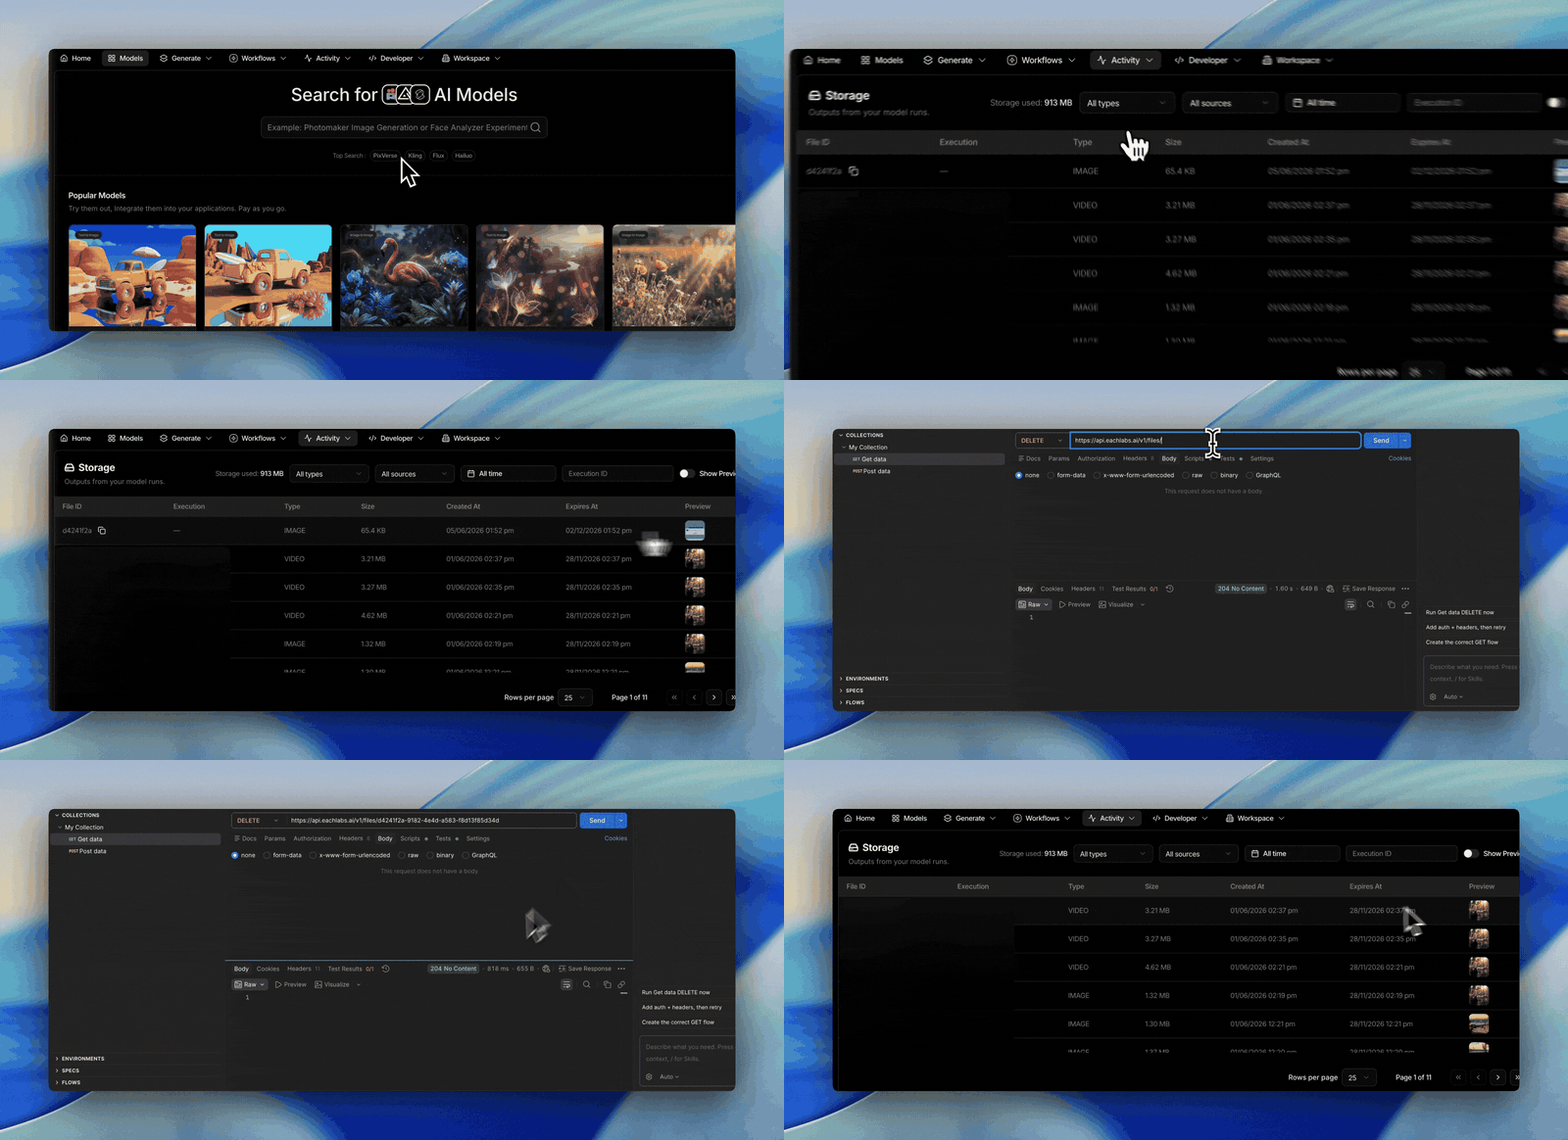
Delete files from the dashboard
- Organization owners can delete a file from the Storage page (the ⋯ menu, then Delete) or from a run’s page (the delete button under the output).
- When a run produced several files, you choose which one to delete.
- Deleting is permanent: the file’s link stops working everywhere, including in runs and workflows that reused it.
- Members who are not owners don’t see delete controls. Deleting through the API with Delete File works as before.
MCP
each::labs plugin for Claude and Codex
- The plugin bundles the each::labs MCP connector with twelve skills for common media tasks: image and video generation and editing, music, voice, fashion, product visuals and workflows.
- Install it from the
eachlabs/pluginmarketplace: under Customize > Plugins in claude.ai and Claude Desktop, withclaude plugin install eachlabs@eachlabsin Claude Code, and withcodex plugin add eachlabs@eachlabsin Codex. - Sign-in, billing and the tools are the same as with the connector alone. Steps are on the Claude and Codex pages.
MCP
each::labs MCP server: run models and workflows, and use interactive cards
- Run any each::labs model, not only video tools:
search_modelsandget_model_schemafind a model and its inputs, andrun_modelruns it, with up to 8 variants of one request. - Run your organization’s workflows:
list_workflows,get_workflow,trigger_workflowandget_workflow_execution. - Interactive cards in AI apps with a chat interface that support MCP Apps: upload files, view and download results, choose one of several variants, adjust a model’s settings, fill in a workflow’s inputs, compare an edit with the original, and trim or crop by dragging. Apps without a chat interface, such as terminals, have no cards: they show results as links and ask you in the chat instead.
- A long job comes back as running with its id; check it with
get_job, orget_workflow_executionfor a workflow, until it is done. - New
list_recent_jobslists your organization’s recent runs (id, model, status, time and result link) so the AI can pick up a run it started earlier. - New permissions
workflows:run,workflows:readanduploads:create. Existing connections keep working for the video tools; reconnect to approve the new permissions and see the new tools. - Details are on the MCP Server page and in the MCP tool reference. Using it from Claude: Use each::labs in Claude.
LLM Router
Use any OpenRouter chat model with the LLM Router
POST /v1/chat/completionsaccepts any chat model ID from OpenRouter’s model list. Send the ID exactly as listed.- Available Models now lists our featured models and every other available model, and shows the matching OpenRouter ID when a featured model’s ID differs.
- Pricing is the model’s list price plus the same standard platform fee OpenRouter charges, nothing more.
- The model catalog API reference moved to each::router.
Webhooks
Redeliver a webhook from the dashboard
- Open a webhook on the Webhooks page and choose Redeliver to send the same payload to your endpoint again, without re-running the execution.
- The button is offered only when a redelivery would be accepted, and names the reason when it would not: a delivery still in flight, a short cooldown after a previous redelivery, or a payload that is no longer stored.
- A redelivery carries
X-Webhook-Redelivery: true, which an ordinary delivery never sends, so your endpoint can tell the two apart. - Signed webhooks are signed again when the redelivery is sent, so it passes your timestamp tolerance rather than looking like a replayed request. See Redeliveries are signed again.
- The body is unchanged, so handle deliveries idempotently and key on
execution_id.
API
Ask structured questions with the Decisions API
POST /v1/decisionsanswers typed questions over one shared context and returns structured results instead of prose: anoulquestion gives you a probability, achoicequestion a named option, and ascorequestion a rating on an ordered scale.- Send
model: "typesafe/jev-1.13"withstateandquestions, authenticated with the same Bearer API key as the rest of each::api. The response carriesanswerskeyed by your question names plus billableusage. - The model is routed through OpenRouter to TypeSafe Jev. This API is in alpha and its contract may change — see the Decisions API page.
API
Webhook deliveries are now signed with HMAC-SHA256
- Set a
webhook_secretwhen creating a prediction or triggering a workflow, and every delivery for that execution now carriesX-Webhook-SignatureandX-Webhook-Timestamp. - The signature is an HMAC-SHA256 over
<X-Webhook-Timestamp>.<raw request body>, hex-encoded and prefixed withsha256=. - The new Verifying Webhook Signatures guide covers the procedure, with Python and JavaScript handlers.
- The plain-text
X-Webhook-Secretheader is still sent, so receivers comparing it keep working. Verify the signature instead — it also proves the body was not modified. - Deliveries triggered without a
webhook_secretare unchanged and remain unsigned.
API
Model details now use a path-based endpoint
GET /v1/models/{slug}is now the single route for retrieving model details. It returns the same payload as before, including the nullablecostguidance.- The deprecated
GET /v1/model?slug=query route has been removed. Update any integration that used it toGET /v1/models/{slug}.
Organization Settings
Control execution and storage retention for your organization
- Organization Settings now puts execution data and stored file retention in your hands. Choose how long each type of data is kept to match your team’s needs.
- Manage execution retention and storage retention separately, with automatic cleanup based on your organization’s settings.
- Review and update your retention preferences in one place as your team’s data policies evolve.
LLM Router
An easier LLM Router interface and errors by model
- LLM Router now uses the same model-aware form on model pages and in both workflow editors. Edit prompts, upload images, and adjust supported options through familiar controls that adapt to your selected model.
- In Canvas Workflows, add and connect LLM Router like any other model card. The shared interface makes it easier to move from trying a model to using it in a workflow.
- Error Analytics now breaks down LLM Router errors by the requested model, so you can see which models are failing and focus your investigation.
API
Traverse execution history with cursor pagination
GET /v2/executionslists organization-wide execution history in descending creation order with the same filters as V1, a default limit of 20, and a maximum limit of 100. Authenticate with your API key as a Bearer token.- Follow the opaque
next_cursoronly whilehas_moreis true. Keep the same filters and limit for each page; restart without a cursor to change them. GET /v1/executionsis deprecated but remains available for shallow compatibility. Requests beyond the 1,000-row prefix (offset <= 1000 - appliedLimit) return{"error":"V1 execution pagination is limited to 1000 rows; use GET /v2/executions with cursor pagination"}.
Billing
Create spending alerts for your organization
- The dashboard now has Activity → Alerts for organization-wide spending alerts.
- Create threshold rules for rolling charged spend, enable or disable them, and review the 20 most recent triggers from the same page.
- Alert emails are sent to the organization owner and billing managers, with the charged spend, threshold, rolling window, and evaluation time included for reconciliation.
Replay
Test model changes against real past runs
- Replay re-runs a sample of successful past executions on a compatible test model, so you can compare outputs and cost on your real inputs before switching.
- Pick a time window and sample size, then confirm the suggested field mapping. The preview shows which runs are eligible, explains any skips, and gives you the original sample’s baseline cost before you start.
- Set a soft cost cap, pause or resume an active test, and inspect the original and replayed inputs and outputs side by side. The final totals show how the test model’s actual cost compares with the original runs.
- You can also keep the same model and change its mapped inputs to test a parameter variant without changing live traffic.
Model fallback
Keep model requests running with fallback chains
- Direct-model fallback lets an async prediction recover when its primary model fails. Compatible fallback models are tried in the order you choose, and the first success completes the original request; when the primary succeeds, the backups do not run.
- Open a model from AI Models and choose Fallbacks to create one or more named chains. Start from a curated recommendation when one is available, or pick compatible models yourself, reorder them, and confirm how the primary model’s inputs map to each fallback.
- Every chain has a stable request selector. Add
"fallback_selector": "your-chain"to an async prediction request to use it. Only enabled, saved chains run, and changes apply to new requests.
API
See model cost guidance before execution
GET /v1/models/{slug}andGET /v1/model?slug={slug}include a nullablecostfield with a fixed estimate or concise usage-based guidance when a reliable public estimate is available.- Estimates may change with provider rates, promotions, or model configuration. Use
metrics.coston the completed prediction or workflow execution for the settled value.
API
Read your organization balance with an API key
GET /v1/billing/balancereturns your authenticated organization’s USD balance as a number, using the same Bearer API key as the rest of each::api.- The route has no organization selector and returns no wallet, credit, organization, or credential details.
- Balance reads are eventually consistent after a top-up. Retry with bounded backoff under the process-local 3 requests-per-second, burst-3 limit; a limited request returns
429withRetry-After: 1, and an unavailable balance returns503instead of a fabricated zero.
each::workflows
Build an HTTP step from a cURL command, and decide when it fails
- Paste a cURL command from a provider’s docs into an HTTP request step and it fills itself in — method, URL, headers, query parameters, and body. An import now replaces the form rather than merging into it, so fields the command does not mention stop carrying values from the import before it.
- Pick a field out of the response instead of guessing at it. An HTTP step offers its response body and its
status_codewherever you choose a reference, so you can feed one field into the next step or branch on a200against a429. The picker learns the shape of a response from the last run, from Send test request, or from a sample response you paste into the step’s settings, and pins any media it finds to the top. - A Fail when rule decides what counts as a failure: connection errors only, any non-2xx response, or a list of status codes you name. A
503from your endpoint no longer reads as a successful step. - An HTTP step can name a second request as its fallback, not just a model. When a response matches the failure rule, the backup request runs instead of the workflow carrying a bad response forward.
- A failure raised by the rule names the status it saw and the rule that rejected it, instead of a generic service error.
- The step timeout has a five-second floor, so a mistyped value cannot fail every request.
- Both editors get all of it: the HTTP card on the canvas and the HTTP step in the step editor.
Canvas Workflows
Copy cards into another tab, or another workflow
⌘Con the canvas now copies to your system clipboard, so a copy outlives the tab that made it. Paste those cards into a second tab, or into an entirely different workflow.- Cards pasted into a different workflow arrive with credential parameters stripped. Paste back into the workflow you copied from and they come through untouched.
Canvas Workflows
Canvas Workflows is in open beta
- Canvas Workflows builds a workflow as a graph you draw: drop model, input, HTTP request, choice, and output cards onto a canvas and wire them together, instead of filling in an ordered list of steps. Start one with Create Canvas on your workflow list, and find them under Canvas Workflows in the sidebar.
- The wires are the workflow. Connecting two cards is what binds one step’s output to the next step’s input, so what you draw is what runs — there is no separate mapping screen to keep in sync.
- A canvas workflow runs as a dependency graph, so independent branches run at the same time. Run the whole flow, a single card, a group, or everything from one card onward, and open the Playground without leaving the editor.
- Canvas Workflows and My Workflows are one library split by editor: workflows you build on the canvas appear in the new list, the ones you already have keep the editor they have today, and both trigger through the same workflow API. The canvas needs a desktop browser; on a phone a workflow opens in the step editor.
- It is an open beta, available to every account. Breaking changes may still land as we build. Tell us what you hit:
[email protected].
each::workflows
Organize workflows with tags
- My Workflows now has tags, so you can label your workflows and find your way around a large library.
- Filter the list by tag from the toolbar, with a searchable set of checkboxes for narrowing down.
- Every tag shows how many workflows carry it — an exact count up to 999, then
999+. - A workflow carries up to three tags. Once you reach the limit the picker shows which rows are locked and why, and the same limit applies over the API. Filtering by tag is not limited.
- Tagging a workflow no longer reloads the list: the picker stays open, your scroll position holds, and the counts update on the click.
Canvas Workflows
Partial runs follow the graph, and every output wire comes back
- Run from here now starts independent branches at the same time, instead of making unrelated work queue behind whatever is in front of it.
- A workflow whose output is mapped from more than one step now opens with every one of those wires drawn. Saving after you reopen keeps the whole output mapping rather than trimming it down to a single key.
- Deleting a selection undoes in one
⌘Zinstead of several. - Run status badges announce each step’s status to screen readers.
each::video
Video API: the video catalog behind one API
- The Video API page is live under Platform, presenting the video model catalog — generation, editing, lipsync, upscaling and more — behind one API.
- Explore gains a Video Editing tab for browsing the video editing models on their own.
LLM Router
20 flagship models join the LLM Router
- Twenty new flagship models are listed in the catalog and callable through the LLM Router — among them Kimi K3, Grok 4.6 and 4.5, the Qwen 3.8 family, Meta’s Muse models, and ByteDance Seed 2.1 Turbo — bringing a current vision-capable model to nearly every family.
API
List executions across all organization API keys
GET /v1/executionsnow returns execution history for every API key in the organization that owns the authenticated key. A cost or usage pipeline no longer needs one request per key, and a newly created key is included automatically instead of silently dropping out of reporting.- Behavior change: this endpoint previously returned only the executions created with the authenticated key. There is no way to ask for that narrower result, so a caller that depended on it now receives its whole organization.
- Scope never widens past your own organization. The query parameters and the response shape are unchanged.
Canvas Workflows
Run part of a canvas, and read the results
- Running one card or a group no longer locks the rest of the editor: each run carries its own progress and its own cancel.
- A group or partial run starts every card that is ready at the same time, so unrelated cards in the same run do not queue behind each other.
- The Runs rail keeps your recent runs, lets you dismiss the ones you are done with, and stacks results down the panel so you can read them without scrolling sideways.
Canvas Workflows
Branches, grouped outputs, and wiring that shows you where it can go
- A Choice card is now a real branch in the workflow, so rewiring one on the canvas changes what actually runs.
- Drop a Choice branch onto a card body and that branch runs the card, so a condition can control a whole step and not only fill in a parameter.
- Disconnecting or deleting a card clears everything it had wired, including connections made through a Choice, so nothing stale is left behind to break the next run.
- Output cards show a grouped mapping as grouped values instead of
[object Object], and you can build a group by dragging mapping rows into one. - An array output lists each item once, at its real count, so picking a value no longer hides or duplicates your choices.
- A multi-file input binds to a whole array parameter, so a model receives your files as one list.
- An HTTP card’s output can pass through a Choice and into a model parameter.
- Ports that would refuse a connection dim while you drag — including drops that would create a loop, and cards with no model chosen — so you can see a dead end before you let go.
Canvas Workflows
Notes, dialogs, and groups hold their shape
- The add-input dialog caps its height and scrolls its body, so Save and Cancel stay reachable however many file defaults you configure.
- Dropping a file onto that dialog’s upload field no longer also drops a duplicate Input card on the canvas behind it.
- Sticky notes grow with what you type, and read like paper rather than another card.
- Drag a group by its visible border instead of hunting for a small handle.
- Cards simplify as you zoom out, so a large canvas stays readable at a glance.
each::workflows
Import a fal workflow into Each
- Drop a fal workflow JSON into the dashboard and it imports into Each, matching each fal model to its closest Each equivalent as it goes.
each::workflows
Workflow outputs and history read across your whole organization
- A large workflow step output can be read by any API key in the organization that owns it, not only by the key that produced the run.
- Execution history for a workflow comes back as one list with one total, so no runs go missing from it.
API
Workflow API errors keep their machine-readable codes
- Errors from the workflow REST endpoints keep their
codefield, so a client can go on handlingNOT_FOUNDand its siblings without having to read the message text.
Canvas Workflows
Keyboard shortcuts, and canvas flows that run as graphs
- Press
/to open the add palette,⌘⇧Gto ungroup,⌘Sto save, and reach the toolbar from the keyboard: select, pan, fit view, tidy up, Playground, run history, run from here, and run to here. ⌘Enterfinishes the edit you are in and can only start one run, so typing in a dialog cannot kick off a paid run by accident.- A workflow you build on the canvas runs as a dependency graph automatically. The run bar no longer asks you to pick a Parallel mode that could drop results.
- The Playground can hold several canvas runs at once, with Cancel and Run side by side while earlier runs keep going.
- Partial runs are available from the toolbar and from a card’s own actions, so you can run a slice without leaving the editor.
Canvas Workflows
Parameters use the type they declare
- A number or a boolean parameter keeps its declared type even when its name contains a word like
image, so ports connect on what a parameter actually is. - A parameter that accepts more than one type opens the right editor, so inputs such as a list of image URLs can be filled in from the canvas.
LLM Router
Gemini 3.7 Flash is available through the LLM Router
google/gemini-3.7-flashis listed in the model catalog and callable through the LLM Router, from the same integration as every other chat model.
API
Low-balance throttling errors explain when to retry
- A prediction request throttled because of a low balance now comes back as a
429that says so, so you know to wait for a running execution to finish rather than retrying blind. - The API reference now documents the low-balance
429and402, including that a rejected submission creates no execution and is not billed.
each::workflows
List your workflows over REST
GET https://api.eachlabs.ai/v1/workflowsreturns the workflows in your organization, newest first. It was previously reachable only from the dashboard.- Filter with
category,keyword, andnode_based; order withsort_keyandsort_direction(both are needed for either to apply); page withlimit(default 50, max 100) andoffset. offsetin the response is the next page’s start rather than an echo of the one you sent, and it is present whenever the page came back full — page until a page returns fewer thanlimitrows.- Rows carry summary fields only. Use Get Workflow for a workflow’s versions and definition.
each::workflows
All workflow endpoints are documented on api.eachlabs.ai
- Every documented workflow REST endpoint now lives on
https://api.eachlabs.ai/v1, including get workflow, update workflow, and the public workflow read and trigger routes. - Update Workflow accepts
nameonly. The previously documenteddescription,locked, andproductionfields were never honored;categoriesworked on the legacy host but is no longer updatable through this endpoint and is ignored if sent. A rename regenerates the workflow slug. - The public workflow trigger returns
{"execution_id": "...", "status": "queued"}on202. Thestarted_atfield the docs claimed was never returned. - The categories endpoint is no longer documented.
workflows.eachlabs.runkeeps serving existing callers unchanged — this is a documentation move, not a breaking change.
each::video
Video API documentation is now public
- The Video API documentation is now listed in the navigation under each::video: overview, quickstart, capabilities reference, billing and limits, MCP setup, and the acceptable-use, takedown, and versioning policies.
- The API is in beta. It runs on
https://api.eachlabs.aias modeleachlabs-video-api, covering transcoding, trimming, captions, packaging, and analysis capabilities. - The OpenAPI reference for the submit, poll, and cancel endpoints is published alongside the guides.
LLM Router
See the requested LLM in Run History
- Run History now shows the requested
LLM beneath
eachlabs-llm-routerin both table and preview modes. - Routed runs are easier to distinguish without opening each execution.
- API clients can read the same value from
requested_modelinGET /v1/executions; non-router executions returnnull.
API
One authentication scheme and base URL across eachlabs APIs
Authorization: Bearer YOUR_API_KEYis now the documented authentication method for all eachlabs APIs.- Workflow create, trigger, bulk-trigger, and execution endpoints are now
documented on
https://api.eachlabs.ai.workflows.eachlabs.runremains supported for workflow management endpoints.
LLM Router
Transcribe audio files and stream speech
- The LLM Router adds two OpenAI-compatible audio endpoints:
POST /v1/audio/transcriptionsfor file transcription andPOST /v1/audio/speechfor progressively streamed text-to-speech. - Transcription accepts files up to 25 MB — FLAC, MP3, MP4/M4A, OGG, WAV,
or WebM — and returns
jsonorverbose_jsonwith optional word and segment timestamps. It answers in one response, with no prediction polling. - Speech returns raw MP3 or PCM bytes as synthesis progresses, so playback can start before the full clip is ready.
- Both use the same API key and base URL as chat completions, so the OpenAI SDK works with a base URL change alone.
API
Media uploads handle generic image MIME types more reliably
- File inputs can now detect supported image types from the file bytes when an origin serves a valid image as
application/octet-stream. - This fixes valid customer images being rejected by compatible image-edit models.
Usage Analytics
Faster, fresher execution history and error analytics
- Run History and Error Analytics now use the same higher-capacity execution data path, keeping large workspaces responsive as their history grows.
- Error Analytics combines hourly summaries with the latest runs, so recent failures appear without waiting for the next full aggregation window.
LLM Router
Browse supported LLMs from the console
- Signed-in users can now explore the live LLM Router catalog without leaving the console.
- Search and filter the available models, compare their capabilities, then open one preselected in the playground to start testing it immediately.
Pricing
Model pricing pages load reliably across pricing formats
Some Kling and MiniMax model pages could fail to load when a model used a fixed fallback price instead of a formula. Both pricing formats are now supported, so affected model pages and their cost estimates render normally.API
Prediction statuses now match everywhere
- The generated API schema now uses the same prediction status values as
production responses, including
errorfor failed predictions. - Generated clients can handle terminal failures and cancellation responses without translating between conflicting status names.
each::workflows
Cloned workflows start cleanly at version 1
A cloned workflow could inherit the source workflow’s active version number. Every clone now begins at version 1, giving it a clean and predictable version history of its own.each::workflows
Build workflows with up to 40 parallel branches
- A parallel step can now contain up to 40 branches, up from 10, for wider fan-out workloads in a single workflow.
- The editor keeps large parallel steps readable with a scrollable branch list, cleaner connections, and zoom that fits very wide flows.
each::workflows
See exactly what happened in a workflow run
- Workflow history now includes a builder-like flow diagram with live status updates and clear per-step inputs, outputs, errors, duration, and cost.
- Failed runs surface their error at the relevant step, and parallel workflows show the final merged output instead of an intermediate branch.
- You can switch between the new visual inspector and the classic detail view at any time.
Billing
Top up without leaving your run
When a run needs more balance, you can choose a top-up amount, see an estimate of how many similar runs it will cover, and continue to Stripe directly from the run dialog.Pricing
Find current pricing for every public model
- The pricing directory now loads current public model prices from the live catalog.
- Search by model, filter by modality, sort by popularity, release date, name, or price, and inspect tiered pricing without opening each model page.
Usage Analytics
Move from analytics to the exact runs behind them
- Request counts in Usage Analytics now open Run History already filtered to the relevant model while preserving your date range and API-key filter.
- The Webhooks page gained consistent filters, clearer status indicators, and more readable delivery details for faster investigation.
Model Comparison
Compare models and every output side by side
- Model Comparison now offers responsive result grids, a full-screen compare view, thumbnails, keyboard navigation, and direct downloads.
- Multi-output models display every generated result instead of showing only the first one.
API
Filter your executions by error type
GET /v1/executionsnow accepts anerror_classificationquery parameter, so you can narrow a listing to just the executions that failed for a specific reason — for exampleprovider_rate_limitorcontent_moderation.- Pass a comma-separated list to match any of several types (e.g.
error_classification=provider_rate_limit,provider_unavailable); an unrecognized value returns a400so typos surface immediately. - The canonical values are
content_moderation,execution_timeout,invalid_user_input,invalid_model_config,provider_auth,provider_error,provider_rate_limit,provider_unavailable,internal_error, andunknown.
each::storage
Filter your files by model
- The storage page now lets you filter your files by the model that generated them, so you can pull up everything a given model produced in one view.
- You can also filter by source — separate the files you uploaded via the API from the outputs each::labs auto-saved from your executions.
- These join the existing date-range, execution, and file-type filters on the same page.
Usage Analytics
See whether a model’s error rate is normal, or just yours
- Error Analytics now lets you filter to a single model and see your workspace’s error rate for it next to the each::labs platform-wide average for the same model, so you can tell at a glance whether a failure spike is something on your side or the model itself.
- The comparison is color-coded — green when you’re beating the platform average, red when you’re worse — and the benchmark window is labeled so you know what it’s averaged over.
- The page also gained quality-of-life upgrades alongside it: sortable columns, CSV export, error-type tooltips, and a “Yesterday” quick range.
each::storage
Set how long an uploaded file is kept
- When you upload a file you can now pass
expires_in_secondsto control how long it’s retained. Once that window passes the file is removed automatically, so there’s no manual cleanup to schedule. - Leave it out and files keep the default retention, so nothing changes for existing integrations.
- An expired file drops out of list, download, and storage totals exactly like a manual delete, and is purged from the CDN.
each::workflows
Create workflows straight from the API
- You can now create a workflow programmatically with
POST /v1/workflows/create(API-key auth), so a whole pipeline can be provisioned from code instead of only being assembled by hand in the dashboard. - It’s the same workflow object either way: anything you create over the API shows up in the dashboard and runs through the existing trigger flow.
- This is the first half of full workflow management over the API — create now, with more lifecycle operations to follow.
Usage Analytics
A new Error Analytics view shows why your executions fail
- The dashboard now has an Error Analytics page that surfaces your workspace’s error rate and breaks failures down by type, so you can see at a glance what’s going wrong instead of opening runs one at a time.
- Failures are also broken down per model, so you can tell which model is driving your errors.
- It builds on the clearer, provider-side failure messages shipped earlier, now aggregated into rates you can actually act on.
API
Every model now ships an OpenAPI schema
- Every model exposes an OpenAPI 3.0 schema at
GET /v1/models/{slug}/schemas/openapi, and its inputs and outputs render as a typed reference in the model page’s API tab. - The machine-readable schema plugs straight into code generators, validators, and API explorers, while the same schema drives the human-readable reference (types, required flags, defaults, enum values, ranges).
- Coverage is automatic and always in sync: both the endpoint and the API tab are derived from each model’s request schema, so there’s nothing to author or maintain per model.
each::storage
Delete an uploaded file over the API
- API customers can now delete an uploaded file with
DELETE /v1/files/:id(API-key auth, returns204). Files uploaded through the presign flow had no delete path before, so once stored there was no way to remove the object or its record. This closes that gap for storage cleanup and data-deletion or privacy requests. - A delete removes the S3 object and soft-deletes the record, so the file drops out of list, download, and storage totals immediately.
- Deletes are org-scoped: callers can only delete files their own org owns.
Models
New image models in the catalog
- MAI-Image-2.5 Edit is now available for image editing, through both the API and the dashboard.
- Ideogram v4 is available too, with a rendering-speed selector so you can trade quality against latency on each run.
Security
Your API key can no longer leak from the browser
The dashboard used to keep a copy of your key in your browser. Now it never does. Your key stays on the server and signing in uses a secure session. Even a fully compromised browser has no key to steal. Nothing changes for you day to day; the biggest place a key could leak is simply gone.API Keys
Keys are owned by the organization, so they survive people coming and going
- Keys belong to the organization, not the person who created them. So when a teammate leaves, their keys keep working and your integrations don’t break.
- Any API Key Manager or the organization’s primary Owner can delete any of the org’s keys: one place of control, no orphaned keys.
- Every key records who created it, for audit and accountability.
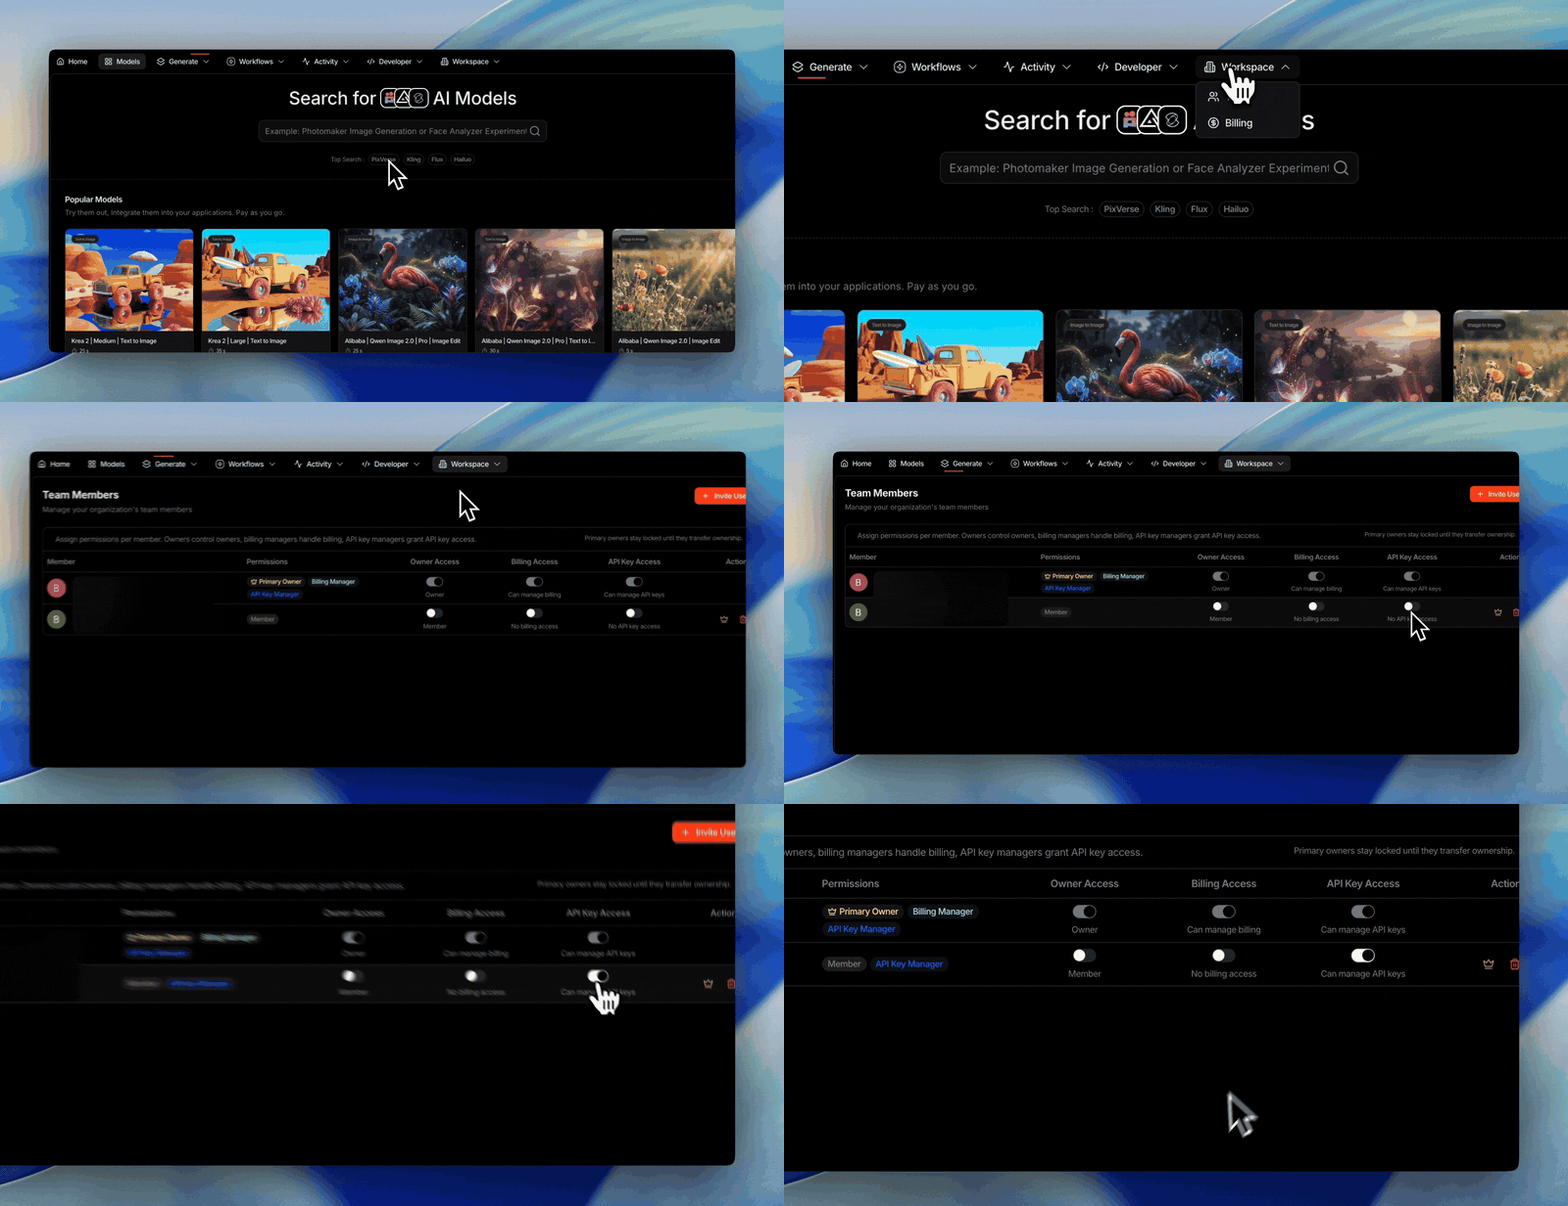
- A new “Can manage API keys” permission (shown as “API key access” in the UI) controls who can create and delete keys, and only that. It doesn’t touch billing, model access, or whether existing keys work.
- Removing that permission from someone never breaks their existing keys. They keep working; the person just can no longer create or delete keys.
- A Manager manages all of the org’s keys; there’s no per-key granularity today.
Security
You hold your key, we don’t, so copy it when you create it
For security, the full key value is shown only once, at the moment you create it, and is never stored anywhere it can be shown again. Copy it then and keep it safe. If it’s ever lost, just create a new key and delete the old one.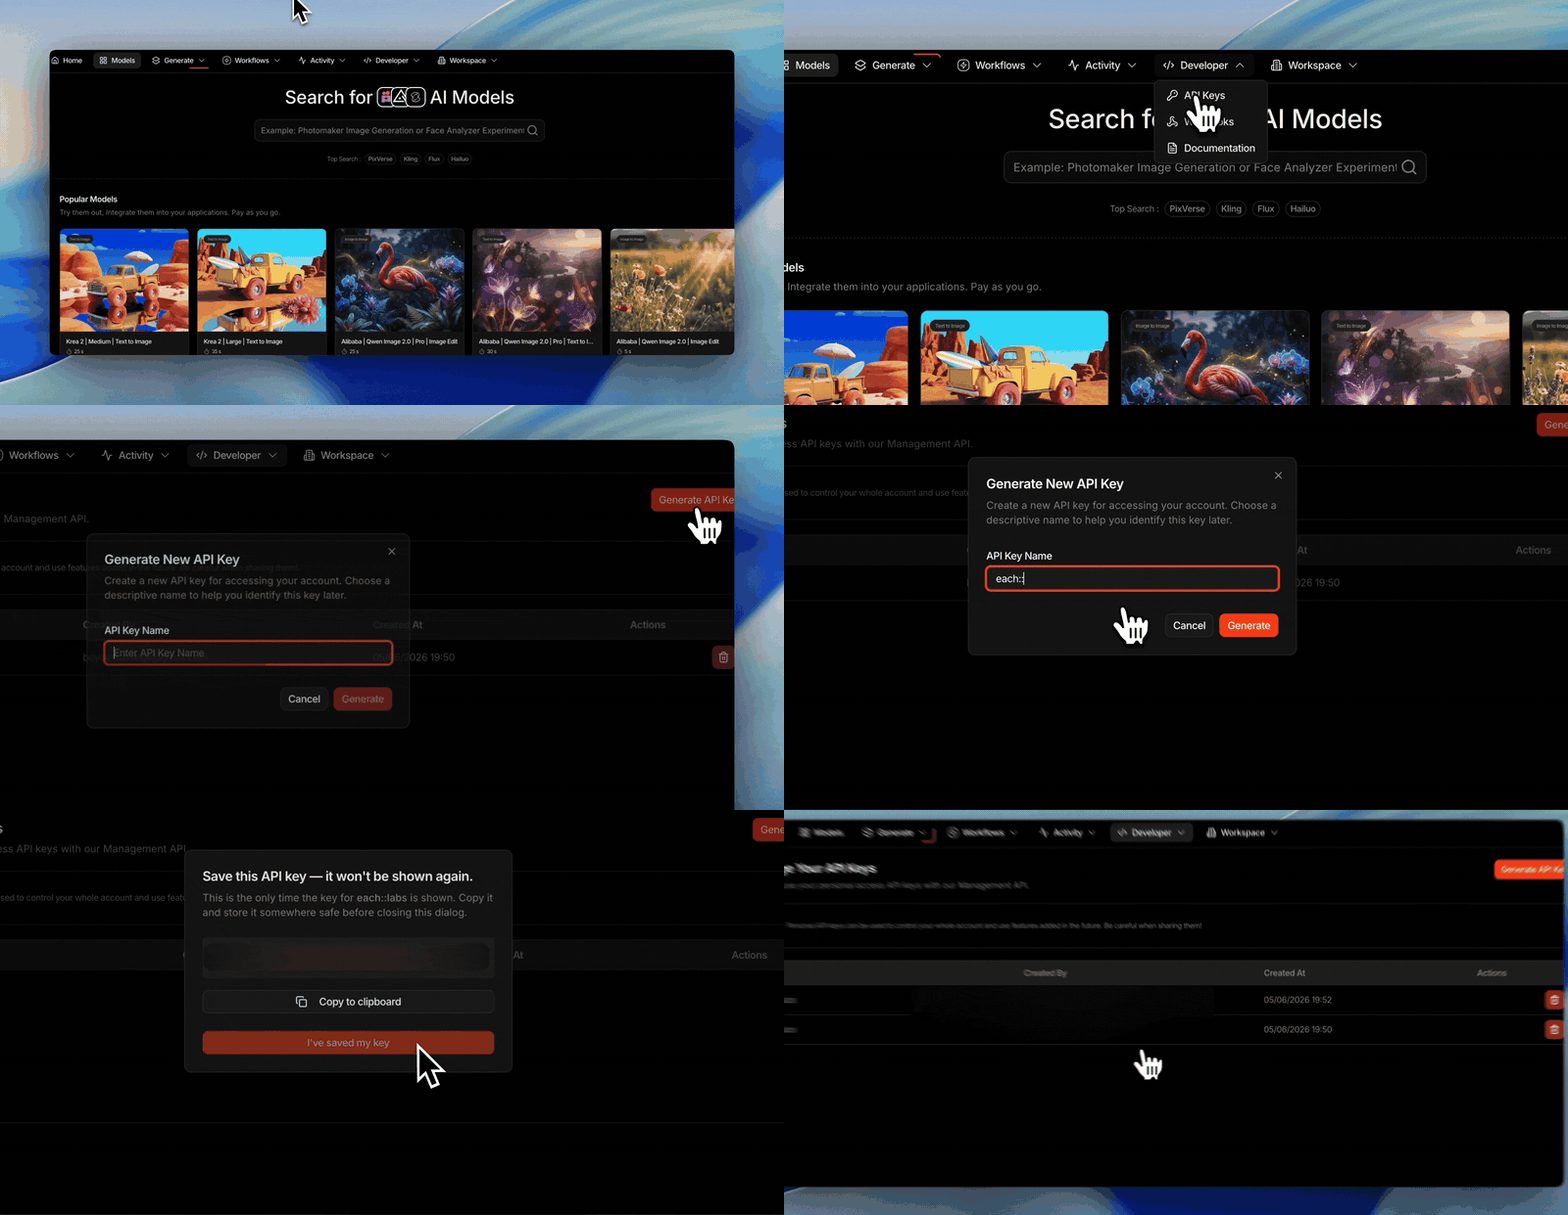
Usage Analytics
You can finally tell dashboard runs apart from API runs
- Executions, usage, and per-model request history now filter by source (Dashboard vs API), by specific key, and by teammate, so you can attribute every run and every dollar of spend to the right key or person. You can even recover history from keys that were later deleted. This came straight from customer feedback.
- The selected view is deep-linkable, so you can share a URL that lands on exactly the breakdown you’re looking at.
- Reported usage is more accurate: internal dashboard traffic no longer inflates your API usage totals.
API
Keys are recognizable at a glance: they start with smk_
The keys you create for the API now begin with smk_, so they’re easy to
spot in your code, your logs, and support tickets.API Keys
New accounts start clean, no confusing unused key
Signing up no longer auto-creates a key you could neither see nor use. Running and uploading inside the dashboard work immediately with zero setup; you create a key only when you actually need external API access.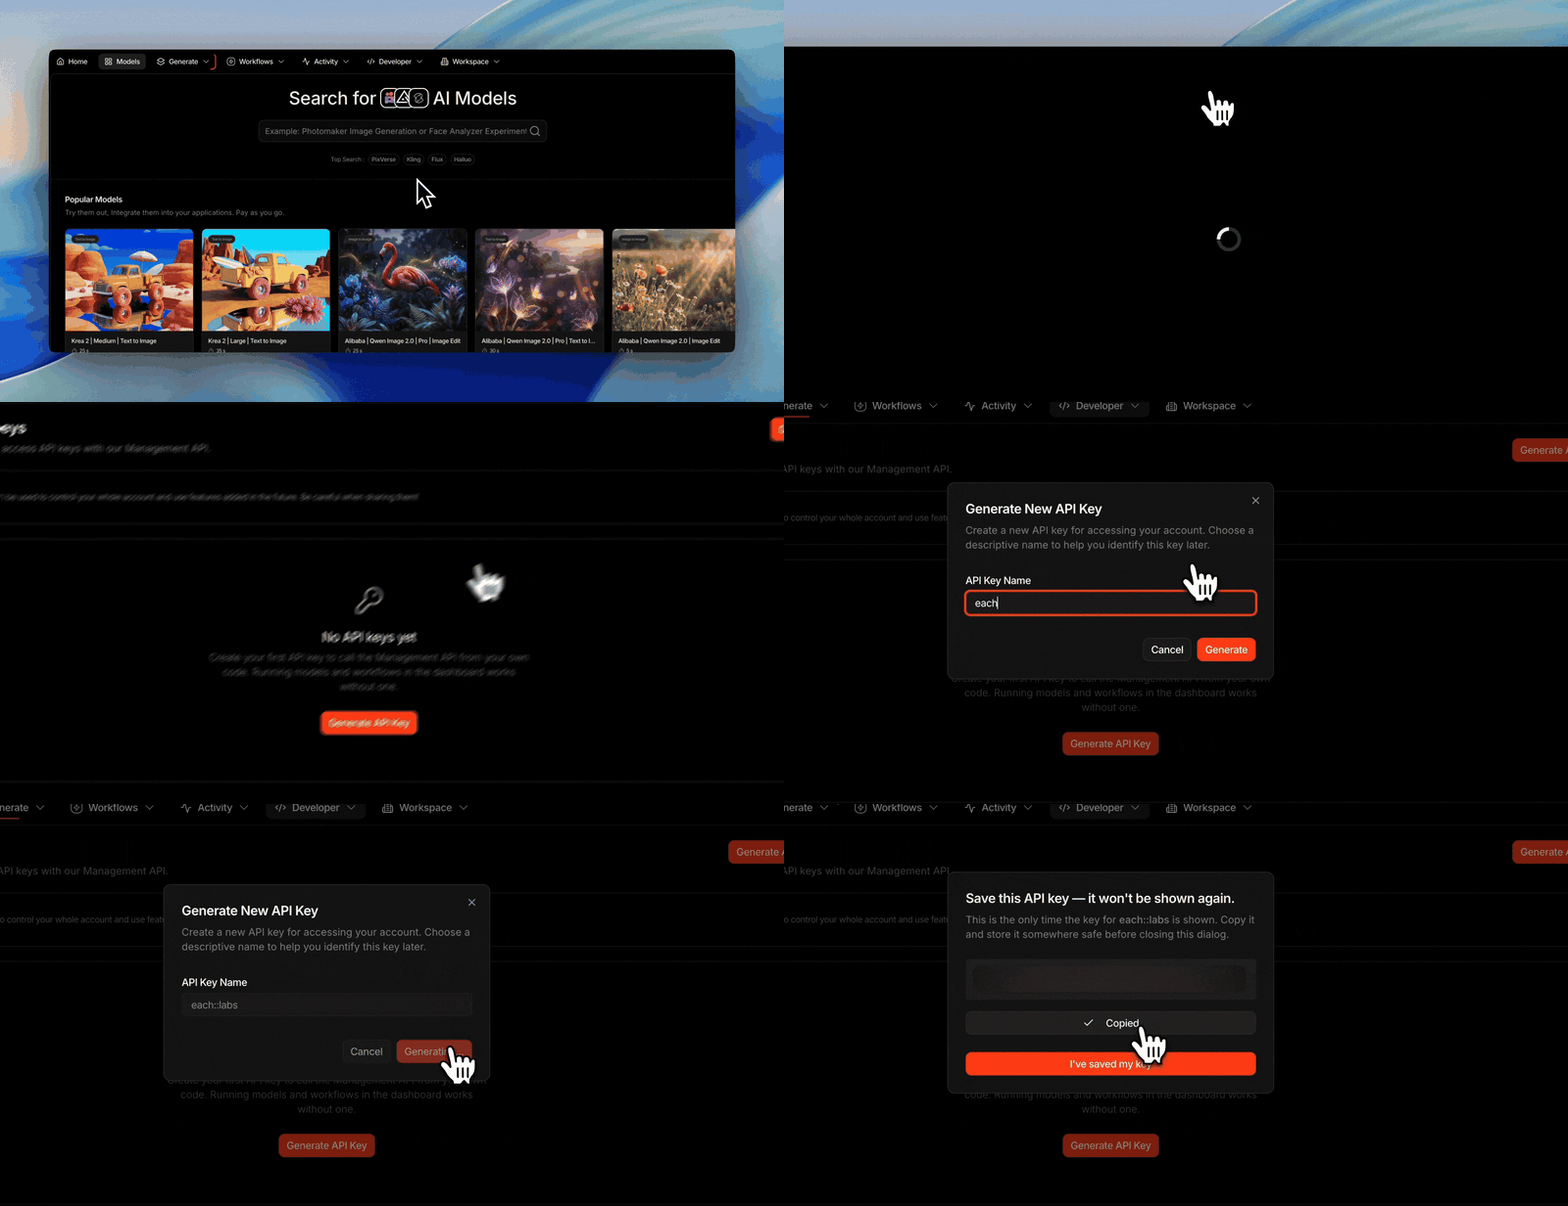
Catalog
Faster model browsing
Model, provider, and family pages are rebuilt on a new data layer, with noticeably faster loads and the newest models shown first.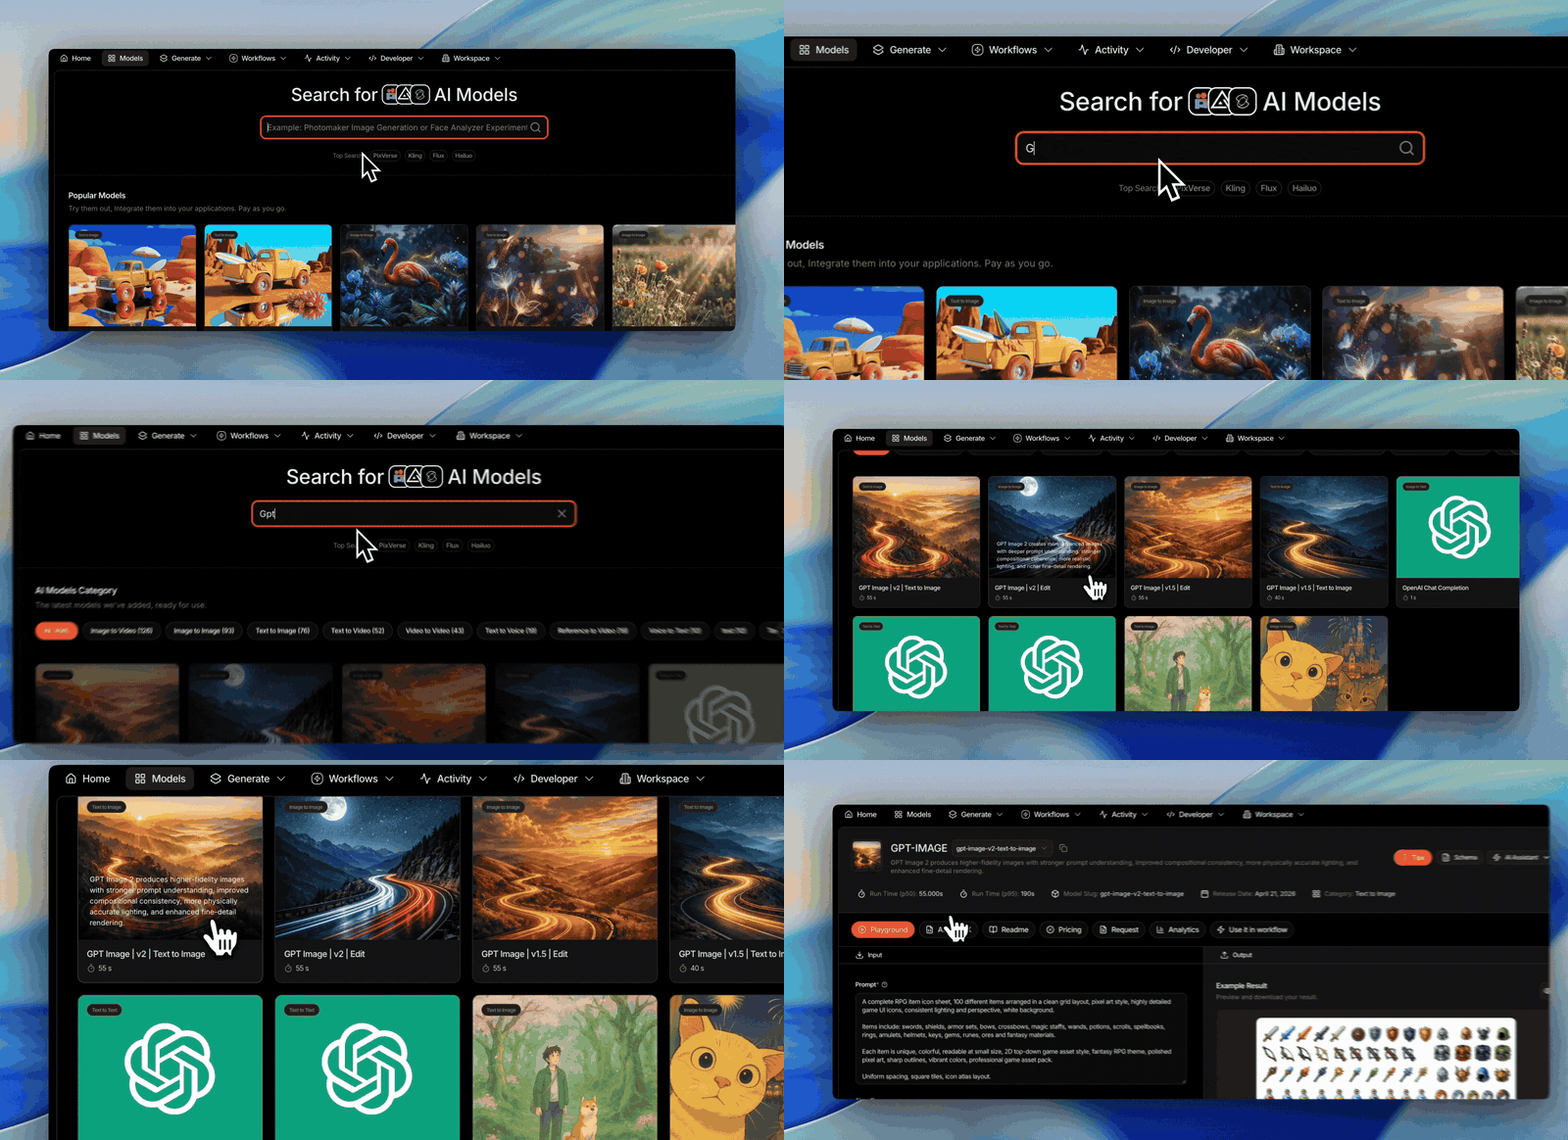
each::storage